Коллекция песен из индийского кинематографа DataSet: различия между версиями
Нет описания правки |
Нет описания правки |
||
| Строка 65: | Строка 65: | ||
# Анализ БД | # Анализ БД | ||
import numpy as np | |||
import pandas as pd | |||
import matplotlib.pyplot as plt | |||
import seaborn as sns | |||
import re | |||
# ========================================== | |||
# A) Imports + Global Config | |||
# ========================================== | |||
np.random.seed(42) | |||
pd.set_option('display.max_columns', 50) | |||
pd.set_option('display.width', 1000) | |||
pd.set_option('display.float_format', '{:.2f}'.format) | |||
plt.rcParams['figure.figsize'] = (12, 6) | |||
plt.rcParams['axes.titlesize'] = 14 | |||
plt.rcParams['axes.labelsize'] = 12 | |||
sns.set_theme(style="whitegrid") | |||
# Provided Inputs | |||
DATASET_NAME = "moonknightmarvel/dataset-of-songs-with-genreartistmovielanguage" | |||
EXACT_COLUMNS = ["title", "artist", "movie", "language", "emotion"] | |||
TARGET_COL = None | |||
# ========================================== | |||
# B) Helper Functions (Robust & Defensive) | |||
# ========================================== | |||
def safe_read_csv(path): | |||
try: | |||
# DATA_DIR is assumed to be defined in the environment per instructions | |||
return pd.read_csv(path) | |||
except Exception as e: | |||
print(f"CRITICAL ERROR: Could not read CSV at {path}. Error: {e}") | |||
return pd.DataFrame() | |||
def validate_columns(df, expected_cols): | |||
if df.empty or not expected_cols: | |||
return | |||
actual_cols = df.columns.tolist() | |||
missing = [c for c in expected_cols if c not in actual_cols] | |||
extra = [c for c in actual_cols if c not in expected_cols] | |||
print("-" * 30) | |||
print(f"COLUMN VALIDATION: {DATASET_NAME}") | |||
if not missing and not extra: | |||
print("Success: All expected columns found. No extra columns.") | |||
else: | |||
if missing: print(f"Missing expected columns: {missing}") | |||
if extra: print(f"Extra columns found: {extra}") | |||
print("-" * 30) | |||
def audit_missingness(df): | |||
null_counts = df.isnull().sum() | |||
null_pct = (null_counts / len(df)) * 100 | |||
non_null = df.notnull().sum() | |||
audit = pd.DataFrame({ | |||
'Null Count': null_counts, | |||
'Null %': null_pct, | |||
'Non-Null Count': non_null | |||
}) | |||
return audit | |||
def detect_column_types(df): | |||
num_cols = df.select_dtypes(include=[np.number]).columns.tolist() | |||
cat_cols = df.select_dtypes(include=['object', 'category']).columns.tolist() | |||
date_cols = [] | |||
# Simple heuristic for potential date columns | |||
for col in cat_cols: | |||
sample = df[col].dropna().head(5).astype(str) | |||
if any(sample.str.contains(r'\d{4}-\d{2}-\d{2}|\d{2}/\d{2}/\d{4}', regex=True)): | |||
date_cols.append(col) | |||
# Refine cat_cols (remove dates) | |||
cat_cols = [c for c in cat_cols if c not in date_cols] | |||
return num_cols, cat_cols, date_cols | |||
def safe_to_numeric(series): | |||
try: | |||
return pd.to_numeric(series, errors='coerce') | |||
except: | |||
return series | |||
def safe_to_datetime(series): | |||
try: | |||
return pd.to_datetime(series, errors='coerce') | |||
except: | |||
return series | |||
def plot_missingness(df): | |||
null_pct = (df.isnull().sum() / len(df)) * 100 | |||
null_pct = null_pct[null_pct > 0].sort_values(ascending=False).head(30) | |||
if not null_pct.empty: | |||
sns.barplot(x=null_pct.values, y=null_pct.index, hue=null_pct.index, palette='Reds_r', legend=False) | |||
plt.title("Top Columns by Missing Percentage (%)") | |||
plt.xlabel("% Missing") | |||
plt.show() | |||
def plot_univariate_num(df, num_cols): | |||
cols_to_plot = num_cols[:12] | |||
if not cols_to_plot: return | |||
n = len(cols_to_plot) | |||
rows = (n + 2) // 3 | |||
fig, axes = plt.subplots(rows, 3, figsize=(18, 5 * rows)) | |||
axes = axes.flatten() | |||
for i, col in enumerate(cols_to_plot): | |||
sns.histplot(df[col].dropna(), kde=True, ax=axes[i], color='teal') | |||
axes[i].set_title(f"Distribution of {col}") | |||
for j in range(i + 1, len(axes)): | |||
fig.delaxes(axes[j]) | |||
plt.tight_layout() | |||
plt.show() | |||
def plot_univariate_cat(df, cat_cols): | |||
cols_to_plot = cat_cols[:6] | |||
if not cols_to_plot: return | |||
for col in cols_to_plot: | |||
if df[col].nunique() > 50: | |||
top_vals = df[col].value_counts().head(15) | |||
else: | |||
top_vals = df[col].value_counts().head(15) | |||
plt.figure(figsize=(10, 5)) | |||
sns.barplot(x=top_vals.values, y=top_vals.index, hue=top_vals.index, palette='viridis', legend=False) | |||
plt.title(f"Top 15 Categories: {col}") | |||
plt.show() | |||
def plot_correlation(df, num_cols): | |||
if len(num_cols) < 2: return | |||
corr = df[num_cols].corr() | |||
plt.figure(figsize=(10, 8)) | |||
sns.heatmap(corr, annot=True, cmap='coolwarm', fmt=".2f", linewidths=0.5) | |||
plt.title("Pearson Correlation Matrix") | |||
plt.show() | |||
# ========================================== | |||
# C) Load + Validate | |||
# ========================================== | |||
df = safe_read_csv(DATA_DIR) | |||
validate_columns(df, EXACT_COLUMNS) | |||
if not df.empty: | |||
# ========================================== | |||
# D) Data Audit | |||
# ========================================== | |||
print(f"\n--- DATA AUDIT: {DATASET_NAME} ---") | |||
print(f"Shape: {df.shape}") | |||
print(f"Memory Usage: {df.memory_usage(deep=True).sum() / 1024**2:.2f} MB") | |||
print(f"Duplicates: {df.duplicated().sum()}") | |||
null_audit = audit_missingness(df) | |||
print("\nNull Audit Summary (Top 5 Missing):") | |||
print(null_audit.sort_values(by='Null %', ascending=False).head(5)) | |||
num_cols, cat_cols, date_cols = detect_column_types(df) | |||
print(f"\nDetected Numeric Columns: {num_cols}") | |||
print(f"Detected Categorical Columns: {cat_cols}") | |||
print(f"Detected Date Columns: {date_cols}") | |||
# Numeric Stability | |||
if num_cols: | |||
inf_counts = np.isinf(df[num_cols]).sum().sum() | |||
print(f"Total Inf/-Inf values: {inf_counts}") | |||
low_var = [c for c in num_cols if df[c].std() < 0.01] | |||
if low_var: print(f"Low variance columns: {low_var}") | |||
# ========================================== | |||
# E) ETL (Safe + Reversible) | |||
# ========================================== | |||
df_clean = df.copy() | |||
# Strip whitespace & Unify Missing Tokens | |||
missing_tokens = ["", "NA", "N/A", "null", "None", "nan"] | |||
for col in df_clean.columns: | |||
if df_clean[col].dtype == 'object': | |||
df_clean[col] = df_clean[col].astype(str).str.strip() | |||
df_clean[col] = df_clean[col].replace(missing_tokens, np.nan) | |||
# Attempt to convert object columns to numeric if they are high-signal | |||
for col in cat_cols: | |||
sample = df_clean[col].dropna().head(10) | |||
if sample.str.match(r'^-?\d+(\.\d+)?$').all(): | |||
df_clean[col] = safe_to_numeric(df_clean[col]) | |||
# Handle Duplicates | |||
df_clean = df_clean.drop_duplicates(keep='first') | |||
# Recalculate types after cleaning | |||
num_cols, cat_cols, date_cols = detect_column_types(df_clean) | |||
# Missing Value Handling (Imputation + Indicators) | |||
for col in num_cols: | |||
if df_clean[col].isnull().any(): | |||
df_clean[f"{col}__was_missing"] = df_clean[col].isnull().astype(int) | |||
df_clean[col] = df_clean[col].fillna(df_clean[col].median()) | |||
for col in cat_cols: | |||
if df_clean[col].isnull().any(): | |||
df_clean[f"{col}__was_missing"] = df_clean[col].isnull().astype(int) | |||
df_clean[col] = df_clean[col].fillna("Missing") | |||
# ========================================== | |||
# F) EDA (Univariate & Bivariate) | |||
# ========================================== | |||
if num_cols: | |||
print("\nNumeric Distribution Summary:") | |||
stats = df_clean[num_cols].agg(['mean', 'std', 'min', 'median', 'max', 'skew']) | |||
print(stats.T) | |||
if len(num_cols) >= 2: | |||
high_corr = [] | |||
corr_mat = df_clean[num_cols].corr().abs() | |||
upper = corr_mat.where(np.triu(np.ones(corr_mat.shape), k=1).astype(bool)) | |||
for col in upper.columns: | |||
for row in upper.index: | |||
if upper.loc[row, col] >= 0.85: | |||
high_corr.append((row, col, upper.loc[row, col])) | |||
if high_corr: | |||
print("\nHighly Correlated Pairs (|r| >= 0.85):") | |||
for r, c, v in high_corr: print(f" - {r} & {c}: {v:.3f}") | |||
# ========================================== | |||
# G) Feature Engineering (Lightweight) | |||
# ========================================== | |||
# String Lengths for Title/Artist etc. | |||
text_candidates = [c for c in cat_cols if c in ['title', 'artist', 'movie', 'language']] | |||
for col in text_candidates: | |||
if col in df_clean.columns: | |||
df_clean[f"{col}__len"] = df_clean[col].astype(str).apply(len) | |||
df_clean[f"{col}__words"] = df_clean[col].astype(str).apply(lambda x: len(x.split())) | |||
# Datetime expansion | |||
for col in date_cols: | |||
df_clean[col] = safe_to_datetime(df_clean[col]) | |||
if not df_clean[col].isnull().all(): | |||
df_clean[f"{col}__year"] = df_clean[col].dt.year | |||
df_clean[f"{col}__month"] = df_clean[col].dt.month | |||
df_clean[f"{col}__dayofweek"] = df_clean[col].dt.dayofweek | |||
# ========================================== | |||
# H) Visualization | |||
# ========================================== | |||
plot_missingness(df) | |||
num_cols_updated, cat_cols_updated, _ = detect_column_types(df_clean) | |||
# Univariate Numerical | |||
plot_univariate_num(df_clean, num_cols_updated) | |||
# Univariate Categorical | |||
plot_univariate_cat(df_clean, cat_cols) | |||
# Bivariate | |||
plot_correlation(df_clean, num_cols_updated) | |||
# Target-Aware Analysis (if TARGET_COL provided) | |||
if TARGET_COL and TARGET_COL in df_clean.columns: | |||
print(f"\nTarget Analysis: {TARGET_COL}") | |||
if TARGET_COL in num_cols_updated: | |||
# Numeric Target | |||
target_corr = df_clean[num_cols_updated].corr()[TARGET_COL].sort_values(ascending=False) | |||
print("Correlations with Target:") | |||
print(target_corr) | |||
else: | |||
# Categorical Target | |||
plt.figure(figsize=(10, 5)) | |||
sns.countplot(data=df_clean, x=TARGET_COL, hue=TARGET_COL, palette='magma', legend=False) | |||
plt.title(f"Target Distribution: {TARGET_COL}") | |||
plt.xticks(rotation=45) | |||
plt.show() | |||
# ========================================== | |||
# I) Final Artifact Output | |||
# ========================================== | |||
print("\n--- FINAL SUMMARY ---") | |||
print(f"Original Shape: {df.shape}") | |||
print(f"Cleaned Shape: {df_clean.shape}") | |||
print(f"Duplicates removed: {df.duplicated().sum()}") | |||
print(f"Columns processed: {list(df_clean.columns)}") | |||
print("\nProcessed Data Preview (df_clean.head()):") | |||
print(df_clean.head()) | |||
else: | |||
print("DataFrame is empty. Pipeline terminated.") | |||
[[Категория:Работы ИНДОР-211]] | [[Категория:Работы ИНДОР-211]] | ||
[[Категория:BigDataWorks]] | [[Категория:BigDataWorks]] | ||
Версия от 12:54, 14 апреля 2026
| Описание модели | Коллекция песен из индийского кинематографа |
|---|---|
| Область знаний | Информатика, Образование, Искусственный интеллект, Большие данные, Музыка, Медиа |
| Веб-страница - ссылка на модель | https://www.kaggle.com/datasets/moonknightmarvel/dataset-of-songs-with-genreartistmovielanguage/data |
| Видео запись | |
| Разработчики | Pocrovskii Alexander |
| Среды и средства, в которых реализована модель | R, Большие данные |
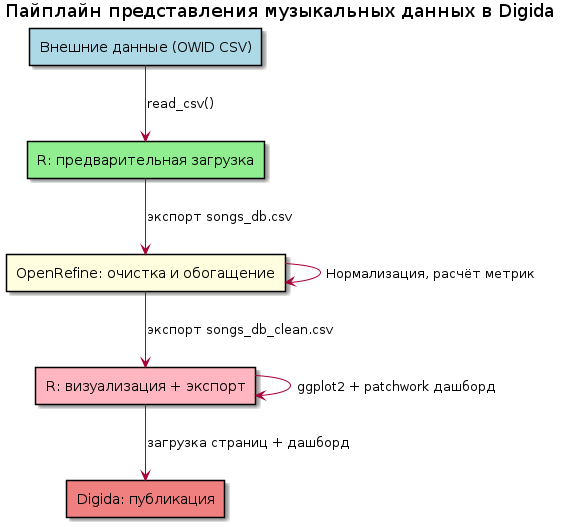
| Диаграмма модели | |
| Описание полей данных, которые модель порождает | |
| Модель создана студентами? | Да |
Общая информация
- Авторы: Студент группы - Pokrovskii Alexander
- Дата исследования: 14 апреля 2026
- Источник: Kaggle Datasets
- Платформа: Kaggle
- Дата публикации: 23 апреля 2026 г.
Исходные данные
- Файл: songs_db.csv (6 КB)
- Структура: 101 строк (избирательных участков), 5 столбцов
- Ссылка: https://www.kaggle.com/datasets/moonknightmarvel/dataset-of-songs-with-genreartistmovielanguage/data
Описание исследования
Исследование посвящено анализу структурированных музыкальных метаданных на примере датасета песен из индийских фильмов.
Цель
Выявить статистически значимые связи между метаданными песен (язык, исполнитель, фильм) и их эмоциональной категорией, а также построить и валидировать модель машинного обучения для прогнозирования эмоции песни на основе доступных признаков с точностью не ниже 75% (F1-macro).
Задачи
- Выполнить предобработку: кодирование категориальных признаков (Artist, Movie, Language), балансировку данных (при необходимости), разделение на обучающую/тестовую выборки.
- Выполнить предобработку: кодирование категориальных признаков (Artist, Movie, Language), балансировку данных (при необходимости), разделение на обучающую/тестовую выборки.
- Построить и сравнить несколько моделей классификации (логистическая регрессия, Random Forest, XGBoost) с кросс-валидацией, оценить метрики качества (accuracy, precision, recall, F1-score).
- Визуализировать результаты: матрицу ошибок, важность признаков, распределение предсказаний, а также сформировать интерпретируемые выводы о доминирующих факторах, влияющих на эмоциональную окраску песни.
Гипотеза
Эмоциональная категория песни (Emotion) статистически значимо зависит от комбинации языка исполнения и исполнителя: песни на телугу в исполнении артистов «первого эшелона» (например, Sid Sriram, Armaan Malik) с большей вероятностью относятся к категориям Love или Joy, тогда как треки второстепенных исполнителей или из менее популярных фильмов чаще маркируются как Sadness или Anticipation. При этом модель, обученная на признаках Language + Artist + Movie, покажет качество прогнозирования эмоции выше базового уровня (majority class baseline) не менее чем на 20 п.п. по метрике F1-macro.
Программный код
<syntaxhighlight lang="R">
- Анализ БД
import numpy as np import pandas as pd import matplotlib.pyplot as plt import seaborn as sns import re
- ==========================================
- A) Imports + Global Config
- ==========================================
np.random.seed(42) pd.set_option('display.max_columns', 50) pd.set_option('display.width', 1000) pd.set_option('display.float_format', '{:.2f}'.format)
plt.rcParams['figure.figsize'] = (12, 6) plt.rcParams['axes.titlesize'] = 14 plt.rcParams['axes.labelsize'] = 12 sns.set_theme(style="whitegrid")
- Provided Inputs
DATASET_NAME = "moonknightmarvel/dataset-of-songs-with-genreartistmovielanguage" EXACT_COLUMNS = ["title", "artist", "movie", "language", "emotion"] TARGET_COL = None
- ==========================================
- B) Helper Functions (Robust & Defensive)
- ==========================================
def safe_read_csv(path):
   try:
       # DATA_DIR is assumed to be defined in the environment per instructions
       return pd.read_csv(path)
   except Exception as e:
       print(f"CRITICAL ERROR: Could not read CSV at {path}. Error: {e}")
       return pd.DataFrame()
def validate_columns(df, expected_cols):
   if df.empty or not expected_cols:
       return
   actual_cols = df.columns.tolist()
   missing = [c for c in expected_cols if c not in actual_cols]
   extra = [c for c in actual_cols if c not in expected_cols]

   print("-" * 30)
   print(f"COLUMN VALIDATION: {DATASET_NAME}")
   if not missing and not extra:
       print("Success: All expected columns found. No extra columns.")
   else:
       if missing: print(f"Missing expected columns: {missing}")
       if extra: print(f"Extra columns found: {extra}")
   print("-" * 30)
def audit_missingness(df):
   null_counts = df.isnull().sum()
   null_pct = (null_counts / len(df)) * 100
   non_null = df.notnull().sum()
   audit = pd.DataFrame({
       'Null Count': null_counts,
       'Null %': null_pct,
       'Non-Null Count': non_null
   })
   return audit
def detect_column_types(df):
   num_cols = df.select_dtypes(include=[np.number]).columns.tolist()
   cat_cols = df.select_dtypes(include=['object', 'category']).columns.tolist()
   date_cols = []

   # Simple heuristic for potential date columns
   for col in cat_cols:
       sample = df[col].dropna().head(5).astype(str)
       if any(sample.str.contains(r'\d{4}-\d{2}-\d{2}|\d{2}/\d{2}/\d{4}', regex=True)):
           date_cols.append(col)

   # Refine cat_cols (remove dates)
   cat_cols = [c for c in cat_cols if c not in date_cols]
   return num_cols, cat_cols, date_cols
def safe_to_numeric(series):
   try:
       return pd.to_numeric(series, errors='coerce')
   except:
       return series
def safe_to_datetime(series):
   try:
       return pd.to_datetime(series, errors='coerce')
   except:
       return series
def plot_missingness(df):
   null_pct = (df.isnull().sum() / len(df)) * 100
   null_pct = null_pct[null_pct > 0].sort_values(ascending=False).head(30)
   if not null_pct.empty:
       sns.barplot(x=null_pct.values, y=null_pct.index, hue=null_pct.index, palette='Reds_r', legend=False)
       plt.title("Top Columns by Missing Percentage (%)")
       plt.xlabel("% Missing")
       plt.show()
def plot_univariate_num(df, num_cols):
   cols_to_plot = num_cols[:12]
   if not cols_to_plot: return
   n = len(cols_to_plot)
   rows = (n + 2) // 3
   fig, axes = plt.subplots(rows, 3, figsize=(18, 5 * rows))
   axes = axes.flatten()
   for i, col in enumerate(cols_to_plot):
       sns.histplot(df[col].dropna(), kde=True, ax=axes[i], color='teal')
       axes[i].set_title(f"Distribution of {col}")
   for j in range(i + 1, len(axes)):
       fig.delaxes(axes[j])
   plt.tight_layout()
   plt.show()
def plot_univariate_cat(df, cat_cols):
   cols_to_plot = cat_cols[:6]
   if not cols_to_plot: return
   for col in cols_to_plot:
       if df[col].nunique() > 50:
           top_vals = df[col].value_counts().head(15)
       else:
           top_vals = df[col].value_counts().head(15)

       plt.figure(figsize=(10, 5))
       sns.barplot(x=top_vals.values, y=top_vals.index, hue=top_vals.index, palette='viridis', legend=False)
       plt.title(f"Top 15 Categories: {col}")
       plt.show()
def plot_correlation(df, num_cols):
   if len(num_cols) < 2: return
   corr = df[num_cols].corr()
   plt.figure(figsize=(10, 8))
   sns.heatmap(corr, annot=True, cmap='coolwarm', fmt=".2f", linewidths=0.5)
   plt.title("Pearson Correlation Matrix")
   plt.show()
- ==========================================
- C) Load + Validate
- ==========================================
df = safe_read_csv(DATA_DIR) validate_columns(df, EXACT_COLUMNS)
if not df.empty:
   # ==========================================
   # D) Data Audit
   # ==========================================
   print(f"\n--- DATA AUDIT: {DATASET_NAME} ---")
   print(f"Shape: {df.shape}")
   print(f"Memory Usage: {df.memory_usage(deep=True).sum() / 1024**2:.2f} MB")
   print(f"Duplicates: {df.duplicated().sum()}")

   null_audit = audit_missingness(df)
   print("\nNull Audit Summary (Top 5 Missing):")
   print(null_audit.sort_values(by='Null %', ascending=False).head(5))

   num_cols, cat_cols, date_cols = detect_column_types(df)

   print(f"\nDetected Numeric Columns: {num_cols}")
   print(f"Detected Categorical Columns: {cat_cols}")
   print(f"Detected Date Columns: {date_cols}")

   # Numeric Stability
   if num_cols:
       inf_counts = np.isinf(df[num_cols]).sum().sum()
       print(f"Total Inf/-Inf values: {inf_counts}")
       low_var = [c for c in num_cols if df[c].std() < 0.01]
       if low_var: print(f"Low variance columns: {low_var}")
   # ==========================================
   # E) ETL (Safe + Reversible)
   # ==========================================
   df_clean = df.copy()

   # Strip whitespace & Unify Missing Tokens
   missing_tokens = ["", "NA", "N/A", "null", "None", "nan"]
   for col in df_clean.columns:
       if df_clean[col].dtype == 'object':
           df_clean[col] = df_clean[col].astype(str).str.strip()
           df_clean[col] = df_clean[col].replace(missing_tokens, np.nan)

   # Attempt to convert object columns to numeric if they are high-signal
   for col in cat_cols:
       sample = df_clean[col].dropna().head(10)
       if sample.str.match(r'^-?\d+(\.\d+)?$').all():
           df_clean[col] = safe_to_numeric(df_clean[col])

   # Handle Duplicates
   df_clean = df_clean.drop_duplicates(keep='first')

   # Recalculate types after cleaning
   num_cols, cat_cols, date_cols = detect_column_types(df_clean)

   # Missing Value Handling (Imputation + Indicators)
   for col in num_cols:
       if df_clean[col].isnull().any():
           df_clean[f"{col}__was_missing"] = df_clean[col].isnull().astype(int)
           df_clean[col] = df_clean[col].fillna(df_clean[col].median())

   for col in cat_cols:
       if df_clean[col].isnull().any():
           df_clean[f"{col}__was_missing"] = df_clean[col].isnull().astype(int)
           df_clean[col] = df_clean[col].fillna("Missing")
   # ==========================================
   # F) EDA (Univariate & Bivariate)
   # ==========================================
   if num_cols:
       print("\nNumeric Distribution Summary:")
       stats = df_clean[num_cols].agg(['mean', 'std', 'min', 'median', 'max', 'skew'])
       print(stats.T)

       if len(num_cols) >= 2:
           high_corr = []
           corr_mat = df_clean[num_cols].corr().abs()
           upper = corr_mat.where(np.triu(np.ones(corr_mat.shape), k=1).astype(bool))
           for col in upper.columns:
               for row in upper.index:
                   if upper.loc[row, col] >= 0.85:
                       high_corr.append((row, col, upper.loc[row, col]))
           if high_corr:
               print("\nHighly Correlated Pairs (|r| >= 0.85):")
               for r, c, v in high_corr: print(f" - {r} & {c}: {v:.3f}")
   # ==========================================
   # G) Feature Engineering (Lightweight)
   # ==========================================
   # String Lengths for Title/Artist etc.
   text_candidates = [c for c in cat_cols if c in ['title', 'artist', 'movie', 'language']]
   for col in text_candidates:
       if col in df_clean.columns:
           df_clean[f"{col}__len"] = df_clean[col].astype(str).apply(len)
           df_clean[f"{col}__words"] = df_clean[col].astype(str).apply(lambda x: len(x.split()))

   # Datetime expansion
   for col in date_cols:
       df_clean[col] = safe_to_datetime(df_clean[col])
       if not df_clean[col].isnull().all():
           df_clean[f"{col}__year"] = df_clean[col].dt.year
           df_clean[f"{col}__month"] = df_clean[col].dt.month
           df_clean[f"{col}__dayofweek"] = df_clean[col].dt.dayofweek
   # ==========================================
   # H) Visualization
   # ==========================================
   plot_missingness(df)

   num_cols_updated, cat_cols_updated, _ = detect_column_types(df_clean)

   # Univariate Numerical
   plot_univariate_num(df_clean, num_cols_updated)

   # Univariate Categorical
   plot_univariate_cat(df_clean, cat_cols)

   # Bivariate
   plot_correlation(df_clean, num_cols_updated)

   # Target-Aware Analysis (if TARGET_COL provided)
   if TARGET_COL and TARGET_COL in df_clean.columns:
       print(f"\nTarget Analysis: {TARGET_COL}")
       if TARGET_COL in num_cols_updated:
           # Numeric Target
           target_corr = df_clean[num_cols_updated].corr()[TARGET_COL].sort_values(ascending=False)
           print("Correlations with Target:")
           print(target_corr)
       else:
           # Categorical Target
           plt.figure(figsize=(10, 5))
           sns.countplot(data=df_clean, x=TARGET_COL, hue=TARGET_COL, palette='magma', legend=False)
           plt.title(f"Target Distribution: {TARGET_COL}")
           plt.xticks(rotation=45)
           plt.show()
   # ==========================================
   # I) Final Artifact Output
   # ==========================================
   print("\n--- FINAL SUMMARY ---")
   print(f"Original Shape: {df.shape}")
   print(f"Cleaned Shape:  {df_clean.shape}")
   print(f"Duplicates removed: {df.duplicated().sum()}")
   print(f"Columns processed: {list(df_clean.columns)}")
   print("\nProcessed Data Preview (df_clean.head()):")
   print(df_clean.head())
else:
print("DataFrame is empty. Pipeline terminated.")