Mapping the Scientific Landscape: различия между версиями
Patarakin (обсуждение | вклад) |
Patarakin (обсуждение | вклад) Нет описания правки |
||
| Строка 124: | Строка 124: | ||
}} | }} | ||
== | == [[Lens]].org and [[OpenAlex]] — collecting our own data == | ||
The Lens is a free platform with more than 200 million scholarly records. It combines data from Crossref, PubMed, Microsoft Academic and [[OpenAlex]]. | The Lens is a free platform with more than 200 million scholarly records. It combines data from Crossref, PubMed, Microsoft Academic and [[OpenAlex]]. | ||
| Строка 136: | Строка 136: | ||
== | == VOSviewer desktop — building our own map == | ||
Open VOSviewer desktop → *Create* → *Create a map based on bibliographic data* → *Read data from bibliographic database files* → choose the **Lens** tab → select ai-game.csv. | Open VOSviewer desktop → *Create* → *Create a map based on bibliographic data* → *Read data from bibliographic database files* → choose the **Lens** tab → select ai-game.csv. | ||
| Строка 143: | Строка 143: | ||
* Co-occurrence of keywords | * Co-occurrence of keywords | ||
---- | |||
== | == [[OpenRefine]] — clean data, better landscape == | ||
OpenRefine is a free, open-source "power tool" for messy data. It cleans data, changes it from one format to another, and connects it to external databases. You do not need to know programming. It runs on your own computer; it uses the browser only as a window, and your data stays on your machine. | OpenRefine is a free, open-source "power tool" for messy data. It cleans data, changes it from one format to another, and connects it to external databases. You do not need to know programming. It runs on your own computer; it uses the browser only as a window, and your data stays on your machine. | ||
Версия от 12:21, 12 ноября 2026
| Описание события | Our topic is "Mapping the scientific landscape". We will see that science is not only a collection of texts. Science is a network of people, papers, words and ideas. And a network can be drawn as a map. |
|---|---|
| Тип события | Мастер класс |
| Начало | 2026-11-12T13:00:06.000Z |
| Окончание | 2026-11-12T16:00:00.000Z |
| color | orange |
| Адрес события | |
| Видео запись события | |
| Среды и средства, которые использовались в рамках события | VOSviewer, Lens, OpenAlex, OpenRefine, PlantUML |
| Формируемые в рамках события компетенции | |
| Область знаний | Социология, Образование, Картография |
| Местоположение | |
| Формат реализации | On-line |
- Before the lesson, check
- Internet access to app.vosviewer.com, lens.org, openalex.org.
- VOSviewer desktop is installed (it needs Java or comes with it, depending on the version).
- OpenRefine is installed and opens in the browser at `http://127.0.0.1:3333`.
The file `ai-game.csv` (exported from Lens.org) is ready, as a backup in case Lens is slow. - A saved VOSviewer JSON file made from `ai-game.csv`, also as a backup.
Opening
Today we will open real data, make real maps, and you will be able to repeat every step now and later at home.
Our topic is "Mapping the Scientific Landscape". We will see that science is not only a collection of texts. Science is a network of people, papers, words and ideas. And a network can be drawn as a map.
First, a short story about maps and science. Then three tools: VOSviewer in the browser, the Lens.org library, and then VOSviewer and OpenRefine on our own computers. If we have time at the end, I will show you one more small tool, PlantUML.
What is Science of Science?
Story 1. Reading an old map
Let me start with a novel. Arturo Perez-Reverte, a Spanish writer, wrote a book called La carta esferica. In English it is The Nautical Chart. In this book, an old sea chart from the 18th century is the key to a lost ship, the Dei Gloria, which sank near the Spanish coast in 1767.
What I like in this story is this: a map alone tells you nothing. You need to know the context. Who made the map? When? With what instruments? What did people know at that time? When you know the context, you can read the map, find the meaning, and rebuild the chain of events.
Sometimes I feel like an old professor of cartography. Students come to me with a map of their research field, or with a guess, and together we try to remember the context and find the story behind the map. This is exactly what we will do today with maps of science.
Story 2. Science grows by making maps
The French sociologist Bruno Latour, in his book Science in Action (1987), shows that science grows when people learn to make new kinds of maps and bring them back to one place. He calls these places "centres of calculation". He tells the story of the French navigator La Pérouse, who came to Sakhalin in 1787. Local people drew the island for him in the sand. La Pérouse wrote it down, and this drawing travelled to Europe and became part of a big map.
Look at the history of science as a history of maps:
- Sea maps of navigators — the map of the Earth.
- Star maps — made with telescopes.
- Maps of cells and molecules — made with microscopes, in biology and biochemistry.
- Maps of economic processes — trade, money, markets.
And now: maps of science itself — made from data about papers, authors and citations.
- What instrument do we need to see science as a whole? A telescope? A microscope?
The Macroscope
The answer comes from Joël de Rosnay, a French biologist and systems thinker. In 1975 he wrote the book Le Macroscope (English edition 1979). A telescope shows things that are very far. A microscope shows things that are very small. A macroscope helps us see things that are very big and very complex — like society, the economy, or science. It is not one machine. It is a set of methods from many disciplines.

The full text of The Macroscope is published on Principia Cybernetica Web — a web project about cybernetics and systems thinking. This project was started by Valentin Turchin, Francis Heylighen and Cliff Joslyn, and Joël de Rosnay was an associate of the project. Turchin's ideas, and this way of building knowledge together on the web.
Katy Börner: anyone can map
Later, Katy Börner from Indiana University made this idea practical. Her books Atlas of Science (2010) and Atlas of Knowledge: Anyone Can Map (2015) show hundreds of maps of science. The main message is in the subtitle: anyone can map. You do not need to be a programmer. Today we will check if this is true.
Barabási: science of science is network science
The last person in my story is Albert-László Barabási, a physicist and one of the founders of network science. His book Linked: The New Science of Networks came out in 2002. Its message is: "think networks". The Internet, cells, companies and groups of friends are all networks, and they follow similar laws.
In 2018, Barabási, Börner and other colleagues wrote a review in the journal Science called "Science of science". They describe science as "a complex, self-organizing, and evolving network of scholars, projects, papers, and ideas". This is our working definition for today.
Socio-semantic networks
- People linked by co-authorship → a social network.
- Words and topics linked because they appear in the same papers → a semantic network.
- Papers linked by citations.
When we put people and ideas together, we get a socio-semantic network: who works with whom, and on what.
VOSviewer Online — a map without installation
VOSviewer is a free tool from Leiden University, made by Nees Jan van Eck and Ludo Waltman. It builds and shows bibliometric networks: co-authorship, citation, co-citation, bibliographic coupling, and co-occurrence of keywords.
We start with the web version, VOSviewer Online. The important thing: you do not need to install anything if you only want to look at a dataset that is already prepared.
Open https://app.vosviewer.com/ and click one of the example maps.
- VOSviewer Online opens only two types of files
- VOSviewer JSON files and VOSviewer map and network files. It does not open raw exports from databases.
Key-words
Authors
The Lens is a free platform with more than 200 million scholarly records. It combines data from Crossref, PubMed, Microsoft Academic and OpenAlex. OpenAlex is a fully open catalogue of world research. It is a non-profit project, and its data is free under the CC0 licence. Lens is a friendly window to this open data.
"gen AI" AND "making game"
Lens can export results in RIS, BibTeX, CSV and JSON. You can export up to 50,000 records. If you want more than 1,000 records, you need to log in.
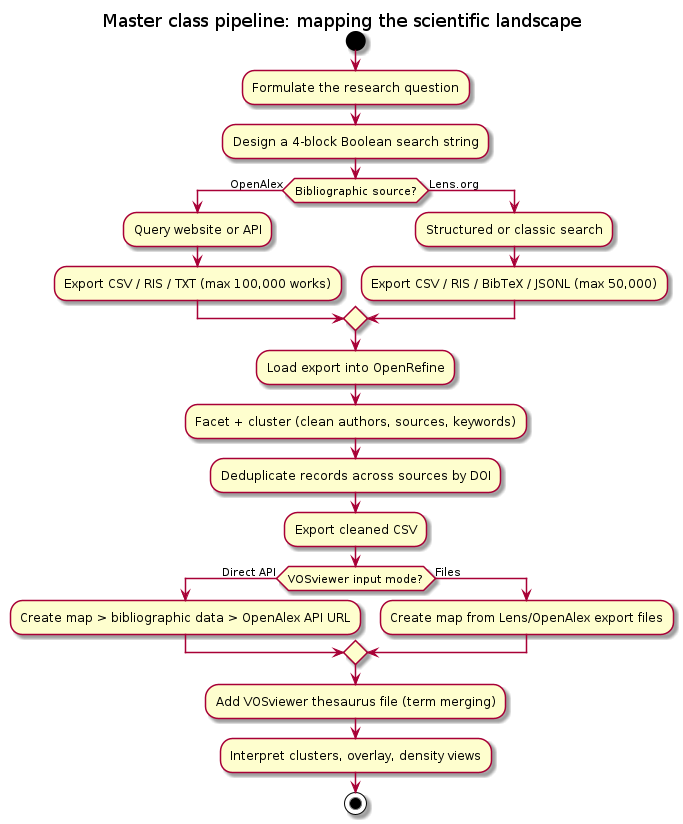
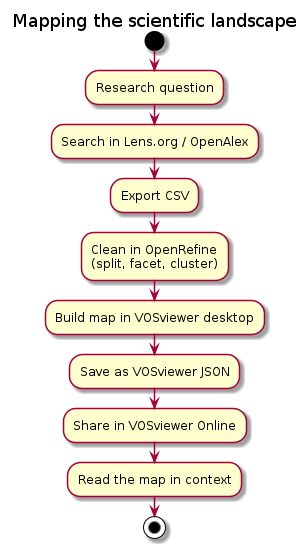
Lens.org → CSV export → (ai-game.csv) → VOSviewer desktop (build the map)
VOSviewer desktop — building our own map
Open VOSviewer desktop → *Create* → *Create a map based on bibliographic data* → *Read data from bibliographic database files* → choose the **Lens** tab → select ai-game.csv.
- Co-authorship of authors
- Co-occurrence of keywords
OpenRefine — clean data, better landscape
OpenRefine is a free, open-source "power tool" for messy data. It cleans data, changes it from one format to another, and connects it to external databases. You do not need to know programming. It runs on your own computer; it uses the browser only as a window, and your data stays on your machine.
Open OpenRefine → *Create project* → choose `ai-game.csv` → *Next* → check the preview → *Create project*.
Keep only the columns we need
*All* (first column menu) → *Edit columns* → *Re-order / remove columns*. Keep, for example: `Lens ID`, `Title`, `Publication Year`, `Author/s`, `Keywords`, `Source Title`
- Lens ID must be the first column.
- This is our rule. Lens ID is a unique identifier of each paper. When we split cells in the next step, OpenRefine uses the first column to understand which rows belong to the same paper.
Split multi-valued cells


In the Lens file, one cell can contain many authors or many keywords, separated by a semicolon.
Column `Author/s` → *Edit cells* → *Split multi-valued cells* → separator `; ` (semicolon **and** space) → OK.
Facet — look at the data
Column `Author/s` → *Facet* → *Text facet*. Sort by count.
Cluster — the most useful skill
OpenRefine finds values that are similar but not the same: different spellings of one name. It shows them to you, and you decide. You can choose the correct version, or type your own. Nothing changes without your approval.
PlantUML (bonus)
PlantUML is a free, open-source tool that makes diagrams from plain text. You write simple text — the tool draws the picture. Because the diagram is text, it is easy to edit, to keep with your project files, and to share. You can try it in the browser at https://www.plantuml.com/plantuml/ without installation.