Обсуждение:Graphviz: различия между версиями
Материал из Поле цифровой дидактики
Patarakin (обсуждение | вклад) |
Patarakin (обсуждение | вклад) (→Icons) |
||
| (не показано 35 промежуточных версий 3 участников) | |||
| Строка 1: | Строка 1: | ||
subgraph cluster_1 { | |||
node [style=filled]; | |||
b0 -> b1 -> b2 -> b3; | |||
label = "process #2"; | |||
color=blue | |||
} | |||
start -> директор; | |||
start -> главный инженер; | |||
руководитель цеха 3 -> руководитель цеха 1; | |||
b2 -> a3; | |||
a3 -> a0; | |||
a3 -> end; | |||
b3 -> end; | |||
start [shape=Mdiamond]; | |||
end [shape=Msquare]; | |||
} | |||
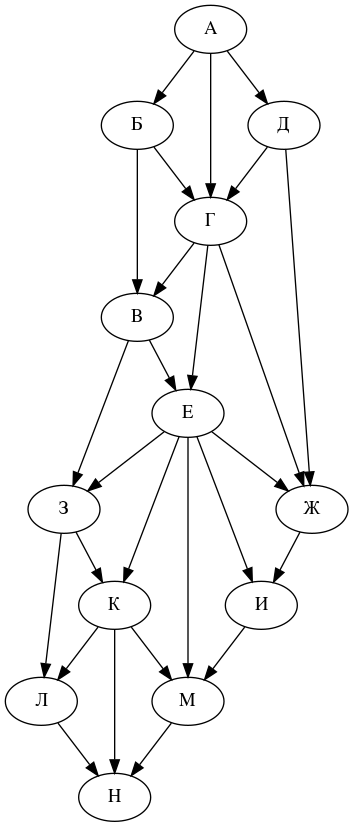
== Представление задания ЕГЭ №13 по информатике с помощью Graphviz == | |||
<graphviz> | <graphviz> | ||
digraph G1 { | digraph G1 { | ||
А -> Б | |||
А -> Г | |||
А -> Д | |||
Б -> Г | |||
Б -> В | |||
Д -> Г | |||
Д -> Ж | |||
В -> З | |||
В -> Е | |||
Г -> В | |||
Г -> Е | |||
Г -> Ж | |||
Е -> З | |||
Е -> К | |||
Е -> И | |||
Е -> Ж | |||
Е -> М | |||
Ж -> И | |||
З -> К | |||
З -> Л | |||
И -> М | |||
К -> Л | |||
К -> Н | |||
К -> М | |||
Л -> Н | |||
М -> Н | |||
} | |||
</graphviz> | |||
== BiblioWork == | |||
<graphviz> | |||
digraph B { | |||
// layout = "sfdp" ; | |||
rankdir=LR; | |||
"Defining Quality Assessment & Evaluation" -> "higher education" | |||
"Definitions of quality in higher education: A synthesis of the literature" -> "higher education" | |||
"An Exploratory Use of the Stakeholder Approach to Defining and Measuring Quality" -> "higher education" | |||
"Developing quality criteria for application" -> "higher education" | |||
"Multi-models of quality in education" -> education | |||
"Competing on the Eight Dimensions of Quality" -> "higher education" | |||
"Examination of the dimensions of quality in higher education" -> "higher education" | |||
"Student perceptions of service quality in a UK university" -> "higher education" | |||
"Internationalizing Quality Assurance in Higher Education" -> "higher education" | |||
"Developing a Holistic Model for Quality in Higher Education" -> "higher education" | |||
"Defining Quality Assessment & Evaluation" -> "internal quality assurance" | |||
"Definitions of quality in higher education: A synthesis of the literature" -> "internal quality assurance" | |||
"Examination of the dimensions of quality in higher education" -> "service quality assurance" | |||
"Student perceptions of service quality in a UK university" -> "service quality assurance" | |||
"Defining Quality Assessment & Evaluation" -> "quality history" | |||
"Definitions of quality in higher education: A synthesis of the literature" -> "quality history" | |||
"Developing a Holistic Model for Quality in Higher Education" -> "model development" | |||
"Defining Quality Assessment & Evaluation" -> "quality definition" | |||
"Definitions of quality in higher education: A synthesis of the literature" -> "quality definition" | |||
"An Exploratory Use of the Stakeholder Approach to Defining and Measuring Quality" -> "quality definition" | |||
"Developing quality criteria for application" -> "quality criteria" | |||
"Multi-models of quality in education" -> "quality models" | |||
"Competing on the Eight Dimensions of Quality" -> "quality dimensions" | |||
"Examination of the dimensions of quality in higher education" -> "quality management" | |||
"Student perceptions of service quality in a UK university" -> "quality perception" | |||
"Internationalizing Quality Assurance in Higher Education" -> "quality assurance" | |||
"Developing a Holistic Model for Quality in Higher Education" -> "quality models" | |||
"Definitions of quality in higher education: A synthesis of the literature" -> "modern quality interpretation" | |||
"An Exploratory Use of the Stakeholder Approach to Defining and Measuring Quality" -> "stakeholders" | |||
"Internationalizing Quality Assurance in Higher Education" -> "internationalization" | |||
"Developing a Holistic Model for Quality in Higher Education" -> "holistic model" | |||
} | } | ||
</graphviz> | </graphviz> | ||
== Only themes == | |||
<graphviz> | <graphviz> | ||
digraph | digraph B { | ||
rankdir=LR ; | rankdir=LR; | ||
node [ | |||
node[color="#2471A3",fontsize=14, fontcolor="white",style=filled, shape="box"] ; | |||
"Defining Quality Assessment & Evaluation" | |||
"Definitions of quality in higher education: A synthesis of the literature" | |||
"An Exploratory Use of the Stakeholder Approach to Defining and Measuring Quality" | |||
"Developing quality criteria for application" | |||
"Multi-models of quality in education" | |||
"Competing on the Eight Dimensions of Quality" | |||
"Examination of the dimensions of quality in higher education" | |||
"Student perceptions of service quality in a UK university" | |||
"Internationalizing Quality Assurance in Higher Education" | |||
"Developing a Holistic Model for Quality in Higher Education" | |||
} | } | ||
</graphviz> | </graphviz> | ||
== | == only labels == | ||
<graphviz> | |||
digraph t { | |||
rankdir=LR; | |||
node[color="LemonChiffon",fontsize=14, fontcolor="black",style=filled, shape="none"] ; | |||
education | |||
"higher education" | |||
node[color="Azure",fontsize=14, fontcolor="black",style=filled, shape="none"] ; | |||
"internal quality assurance" | |||
"service quality assurance" | |||
node[color="CornflowerBlue",fontsize=14, fontcolor="black",style=filled, shape="none"] ; | |||
"quality history" | |||
"model development" | |||
node[color="Bisque",fontsize=14, fontcolor="black",style=filled, shape="none"] ; | |||
"quality definition" | |||
"quality criteria" | |||
"quality dimensions" | |||
"quality management" | |||
"quality perception" | |||
"quality assurance" | |||
"quality models" | |||
node[color="MediumSlateBlue",fontsize=14, fontcolor="black",style=filled, shape="none"] ; | |||
"modern quality interpretation" | |||
"stakeholders" | |||
"internationalization" | |||
"holistic model" | |||
} | |||
</graphviz> | |||
== Full graph == | |||
<graphviz> | <graphviz> | ||
digraph | digraph B { | ||
// layout = "sfdp" ; | |||
rankdir=LR; | |||
node[color="#2471A3",fontsize=14, fontcolor="white",style=filled, shape="box"] ; | |||
"Defining Quality Assessment & Evaluation" | |||
"Definitions of quality in higher education: A synthesis of the literature" | |||
"An Exploratory Use of the Stakeholder Approach to Defining and Measuring Quality" | |||
"Developing quality criteria for application" | |||
"Multi-models of quality in education" | |||
"Competing on the Eight Dimensions of Quality" | |||
"Examination of the dimensions of quality in higher education" | |||
"Student perceptions of service quality in a UK university" | |||
"Internationalizing Quality Assurance in Higher Education" | |||
"Developing a Holistic Model for Quality in Higher Education" | |||
node[color="LemonChiffon",fontsize=14, fontcolor="black",style=filled, shape="none"] ; | |||
education | |||
"higher education" | |||
node[color="Azure",fontsize=14, fontcolor="black",style=filled, shape="none"] ; | |||
"internal quality assurance" | |||
"service quality assurance" | |||
node[color="CornflowerBlue",fontsize=14, fontcolor="black",style=filled, shape="none"] ; | |||
"quality history" | |||
"model development" | |||
node[color="Bisque",fontsize=14, fontcolor="black",style=filled, shape="none"] ; | |||
"quality definition" | |||
"quality criteria" | |||
"quality dimensions" | |||
"quality management" | |||
"quality perception" | |||
"quality assurance" | |||
"quality models" | |||
node[color="MediumSlateBlue",fontsize=14, fontcolor="black",style=filled, shape="none"] ; | |||
"modern quality interpretation" | |||
"stakeholders" | |||
"internationalization" | |||
"holistic model" | |||
"Defining Quality Assessment & Evaluation" -> "higher education" | |||
"Definitions of quality in higher education: A synthesis of the literature" -> "higher education" | |||
"An Exploratory Use of the Stakeholder Approach to Defining and Measuring Quality" -> "higher education" | |||
"Developing quality criteria for application" -> "higher education" | |||
"Multi-models of quality in education" -> education | |||
"Competing on the Eight Dimensions of Quality" -> "higher education" | |||
"Examination of the dimensions of quality in higher education" -> "higher education" | |||
"Student perceptions of service quality in a UK university" -> "higher education" | |||
"Internationalizing Quality Assurance in Higher Education" -> "higher education" | |||
"Developing a Holistic Model for Quality in Higher Education" -> "higher education" | |||
"Defining Quality Assessment & Evaluation" -> "internal quality assurance" | |||
"Definitions of quality in higher education: A synthesis of the literature" -> "internal quality assurance" | |||
"Examination of the dimensions of quality in higher education" -> "service quality assurance" | |||
"Student perceptions of service quality in a UK university" -> "service quality assurance" | |||
"Defining Quality Assessment & Evaluation" -> "quality history" | |||
"Definitions of quality in higher education: A synthesis of the literature"-> "quality history" | |||
"Developing a Holistic Model for Quality in Higher Education" -> "model development" | |||
"Defining Quality Assessment & Evaluation" -> "quality definition" | |||
"Definitions of quality in higher education: A synthesis of the literature" -> "quality definition" | |||
"An Exploratory Use of the Stakeholder Approach to Defining and Measuring Quality" -> "quality definition" | |||
"Developing quality criteria for application" -> "quality criteria" | |||
"Multi-models of quality in education" -> "quality models" | |||
"Competing on the Eight Dimensions of Quality" -> "quality dimensions" | |||
"Examination of the dimensions of quality in higher education" -> "quality management" | |||
"Student perceptions of service quality in a UK university" -> "quality perception" | |||
"Internationalizing Quality Assurance in Higher Education" -> "quality assurance" | |||
"Developing a Holistic Model for Quality in Higher Education" -> "quality models" | |||
"Definitions of quality in higher education: A synthesis of the literature" -> "modern quality interpretation" | |||
"An Exploratory Use of the Stakeholder Approach to Defining and Measuring Quality" -> "stakeholders" | |||
"Internationalizing Quality Assurance in Higher Education" -> "internationalization" | |||
"Developing a Holistic Model for Quality in Higher Education" -> "holistic model" | |||
} | } | ||
</graphviz> | </graphviz> | ||
== Data - fotball == | |||
<graphviz> | <graphviz> | ||
digraph G1 { | |||
layout = "neato" ; | |||
1 -> 300 | |||
2 -> 380 | |||
3 -> 292 | |||
4 -> 306 | |||
5 -> 359 | |||
6 -> 251 | |||
7 -> 290 | |||
8 -> 242 | |||
9 -> 250 | |||
10 -> 356 | |||
11 -> 324 | |||
12 -> 390 | |||
13 -> 337 | |||
14 -> 366 | |||
15 -> 287 | |||
16 -> 262 | |||
17 -> 251 | |||
18 -> 252 | |||
19 -> 401 | |||
20 -> 357 | |||
21 -> 378 | |||
22 -> 296 | |||
23 -> 393 | |||
24 -> 282 | |||
25 -> 351 | |||
26 -> 347 | |||
27 -> 243 | |||
28 -> 320 | |||
29 -> 357 | |||
30 -> 372 | |||
31 -> 300 | |||
32 -> 301 | |||
33 -> 351 | |||
34 -> 301 | |||
35 -> 280 | |||
36 -> 389 | |||
37 -> 295 | |||
38 -> 234 | |||
39 -> 261 | |||
40 -> 335 | |||
41 -> 391 | |||
42 -> 396 | |||
43 -> 301 | |||
44 -> 250 | |||
45 -> 385 | |||
46 -> 352 | |||
47 -> 292 | |||
48 -> 396 | |||
49 -> 386 | |||
} | } | ||
</graphviz> | </graphviz> | ||
== Icons == | |||
<graphviz> | |||
digraph W { | |||
layout = "neato"; | |||
node[fontsize="10", fontcolor="blue", nodesep=2, shape="none", style=""] ; | |||
size="10,10" ; | |||
edge [arrowhead=normal, arrowsize=0.4,len=2.5]; | |||
"User:Кашкина Т.Г." [tooltip="Кашкина Т.Г."] ; | |||
"User:Кашкина Т.Г." [label ="", shape="box" ]; | |||
} | } | ||
</graphviz> | </graphviz> | ||
Текущая версия на 20:57, 15 декабря 2023
 subgraph cluster_1 {
   node [style=filled];
   b0 -> b1 -> b2 -> b3;
   label = "process #2";
   color=blue
 }
 start -> директор;
 start -> главный инженер;
 руководитель цеха 3 -> руководитель цеха 1;
 b2 -> a3;
 a3 -> a0;
 a3 -> end;
 b3 -> end;
 start [shape=Mdiamond];
 end [shape=Msquare];
}
Представление задания ЕГЭ №13 по информатике с помощью Graphviz
BiblioWork

Only themes

only labels

Full graph

Data - fotball

Icons
