Блок-схемы и данные: различия между версиями
Patarakin (обсуждение | вклад) (Новая страница: «{{Событие |Description=вебинар для магистрантов |has start=2022-10-08T09:00:37.000Z |has end=2022-10-08T11:54:37.000Z |color=green |Website=http://digida.mgpu.ru/ }} == Данные == === Как использовать свойства типов данных в Semantic MediaWiki === === Как использовать внешний датасет в Semantic MediaWiki === === Где найти внешние дат...») |
Patarakin (обсуждение | вклад) |
||
| (не показаны 24 промежуточные версии этого же участника) | |||
| Строка 1: | Строка 1: | ||
{{Событие | {{Событие | ||
|Description=вебинар для магистрантов | |Description=вебинар для магистрантов ПБД211М | ||
|has start=2022-10-08T09:00:37.000Z | |has start=2022-10-08T09:00:37.000Z | ||
|has end=2022-10-08T11:54:37.000Z | |has end=2022-10-08T11:54:37.000Z | ||
| Строка 6: | Строка 6: | ||
|Website=http://digida.mgpu.ru/ | |Website=http://digida.mgpu.ru/ | ||
}} | }} | ||
Для магистрантов [[:Категория:ПБД211М|ПБД211М]] | |||
=== Как | == [[Блок-схема]] == | ||
=== Как редактировать блок-схемы на страницах [[Semantic MediaWiki]] === | |||
У нас есть три средства (три языка) представления блок-схем на страницах [[Semantic MediaWiki]]: | |||
# [[graphviz]] | |||
# [[plantUML]] | |||
# [[mermaid]] | |||
=== Блок-схемы в [[graphviz]] === | |||
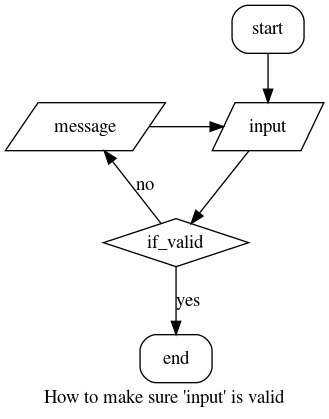
=== | <graphviz> | ||
digraph { | |||
label="How to make sure 'input' is valid"; | |||
node[shape="box", style="rounded"] | |||
start; end; | |||
node[shape="parallelogram", style=""] | |||
message; input; | |||
node[shape="diamond", style=""] | |||
if_valid; | |||
start -> input; | |||
input -> if_valid; | |||
if_valid -> message[label="no"]; | |||
if_valid -> end[label="yes"]; | |||
message -> input; | |||
{rank=same; message input} | |||
} | |||
</graphviz> | |||
=== | ==== Шаблон для диаграммы ==== | ||
=== | <nowiki> | ||
digraph FlowChartName { | |||
rankdir = TB; | |||
compound = true; | |||
splines = ortho; | |||
=== | node [ | ||
shape = "box" | |||
style = "filled, rounded" | |||
fillcolor = 4 | |||
colorscheme = pastel16 | |||
] Start, End; | |||
// Task | |||
node [ | |||
shape = "box" | |||
style = "filled" | |||
fillcolor = 2 | |||
colorscheme = pastel16 | |||
]; | |||
// Data Input/Output | |||
node [ | |||
shape = "parallelogram" | |||
style = "filled" | |||
fillcolor = 3 | |||
colorscheme = pastel16 | |||
]; | |||
// Condition | |||
node [ | |||
shape = "diamond" | |||
style = "filled" | |||
fillcolor = 6 | |||
colorscheme = pastel16 | |||
]; | |||
// Comment | |||
node [ | |||
shape = "box" | |||
style = "dashed" | |||
]; | |||
// Process | |||
node [ | |||
shape = "record" | |||
style = "filled" | |||
fillcolor = 5 | |||
colorscheme = pastel16 | |||
]; | |||
// cluster | |||
// labels | |||
// edges | |||
} | |||
</nowiki> | |||
== [[ | ===== Результат ===== | ||
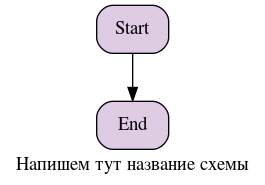
Превратится в блок-схему | |||
<graphviz> | |||
digraph FlowChartName { | |||
label = "Напишем тут название схемы" ; | |||
rankdir = TB; | |||
node [ | |||
shape = "box" | |||
style = "filled, rounded" | |||
fillcolor = 4 | |||
colorscheme = pastel16 | |||
] Start, End; | |||
// Task | |||
node [ | |||
shape = "box" | |||
style = "filled" | |||
fillcolor = 2 | |||
colorscheme = pastel16 | |||
]; | |||
// Data Input/Output | |||
node [ | |||
shape = "parallelogram" | |||
style = "filled" | |||
fillcolor = 3 | |||
colorscheme = pastel16 | |||
]; | |||
// Condition | |||
node [ | |||
shape = "diamond" | |||
style = "filled" | |||
fillcolor = 6 | |||
colorscheme = pastel16 | |||
]; | |||
// Comment | |||
node [ | |||
shape = "box" | |||
style = "dashed" | |||
]; | |||
// Process | |||
node [ | |||
shape = "record" | |||
style = "filled" | |||
fillcolor = 5 | |||
colorscheme = pastel16 | |||
]; | |||
Start -> End | |||
} | |||
</graphviz> | |||
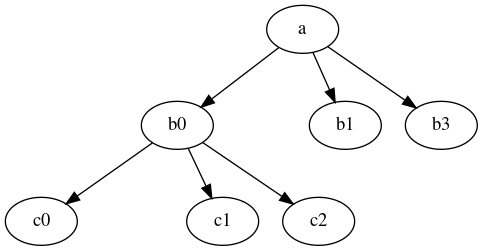
=== | === Пример графа === | ||
<graphviz> | |||
digraph A { | |||
a -> b0 | |||
a -> b3 | |||
xb [label="hi",width=.1,style=invis] | |||
a -> xb [style=invis] | |||
a -> b1 | |||
{rank=same b0 -> xb -> b1 [style=invis]} | |||
b0 -> c0 | |||
xc [label="bye",width=.1,style=invis] | |||
b0 -> xc [style=invis] | |||
b0 -> c1 | |||
{rank=same c0 -> xc -> c1 [style=invis]} | |||
b0 -> c2 | |||
} | |||
</graphviz> | |||
=== Блок-схемы в [[plantUML]] === | |||
=== Блок-схемы в Mermaid === | === Блок-схемы в [[Mermaid]] === | ||
Текущая версия на 13:11, 15 октября 2022
| Описание события | вебинар для магистрантов ПБД211М |
|---|---|
| Тип события | |
| Начало | 2022-10-08T09:00:37.000Z |
| Окончание | 2022-10-08T11:54:37.000Z |
| color | green |
| Адрес события | http://digida.mgpu.ru/ |
| Видео запись события | |
| Среды и средства, которые использовались в рамках события | |
| Формируемые в рамках события компетенции | |
| Область знаний | |
| Местоположение | |
| Формат реализации | |
| Карта |
Для магистрантов ПБД211М
Блок-схема
Как редактировать блок-схемы на страницах Semantic MediaWiki
У нас есть три средства (три языка) представления блок-схем на страницах Semantic MediaWiki:
Блок-схемы в graphviz

Шаблон для диаграммы
digraph FlowChartName { rankdir = TB; compound = true; splines = ortho; node [ shape = "box" style = "filled, rounded" fillcolor = 4 colorscheme = pastel16 ] Start, End; // Task node [ shape = "box" style = "filled" fillcolor = 2 colorscheme = pastel16 ]; // Data Input/Output node [ shape = "parallelogram" style = "filled" fillcolor = 3 colorscheme = pastel16 ]; // Condition node [ shape = "diamond" style = "filled" fillcolor = 6 colorscheme = pastel16 ]; // Comment node [ shape = "box" style = "dashed" ]; // Process node [ shape = "record" style = "filled" fillcolor = 5 colorscheme = pastel16 ]; // cluster // labels // edges }
Результат
Превратится в блок-схему

Пример графа
