Цифровая синхронизация (диаграмма): различия между версиями
Материал из Поле цифровой дидактики
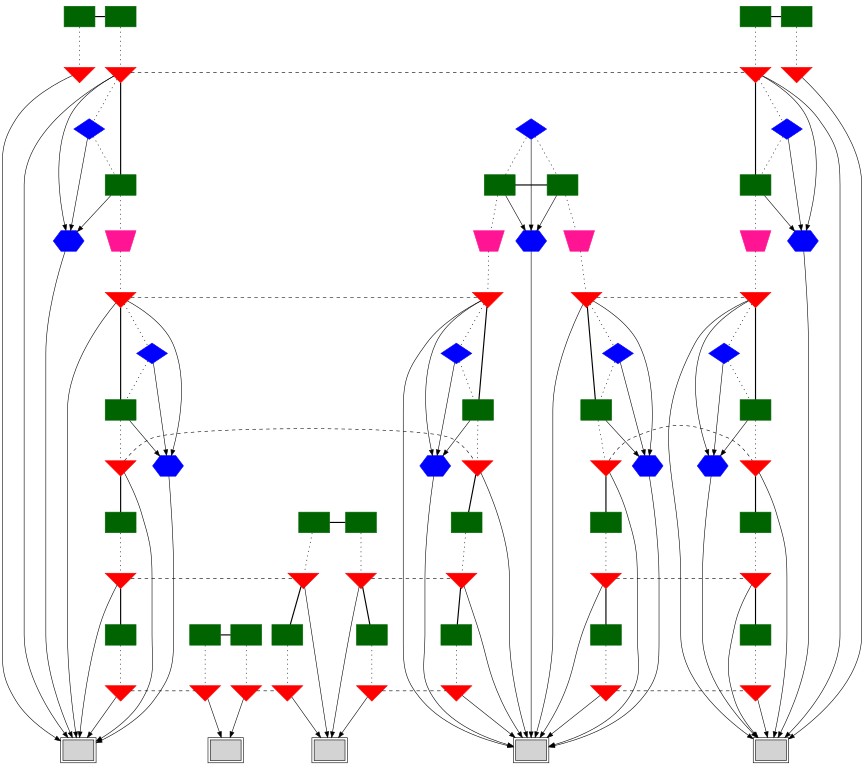
Patarakin (обсуждение | вклад) (Новая страница: « <graphviz> digraph G { size="10,10"; graph[page="8.5,11",ratio=fill,center=1]; node[style=filled,label=""]; subgraph ds3CTP { rank = same; node[shape=box,color=darkgreen]; ds3CTP_1_1; ds3CTP_1_2; ds3CTP_5_1; ds3CTP_5_2; } subgraph t3TTP { rank = same; node[shape=invtriangle,color=red]; t3TTP_1_1; t3TTP_5_2; } subgraph vc3TTP { rank = same; node[shape=invtriangle,color=red]; vc3TTP_1_2; vc3TTP_5_1; } subgraph fabric { r...») |
Patarakin (обсуждение | вклад) |
||
| Строка 2: | Строка 2: | ||
<graphviz> | <graphviz> | ||
digraph G { | digraph G { | ||
size=" | size="9,9"; | ||
graph[page="8.5,11",ratio=fill,center=1]; | graph[page="8.5,11",ratio=fill,center=1]; | ||
node[style=filled,label=""]; | node[style=filled,label=""]; | ||
Версия 16:28, 17 декабря 2022